J. Welles Wilder, a well-known technical analysis pioneer, established the RSI (Relative Strength Index). In 1978, Wilder published the first information on the bounded oscillator indicator in his book New Concepts in Technical Trading Systems, which is a must-have for any forex directory of essential trading publications.
The Relative Strength Index has been one of the most highly observed technical indicators since its debut to the financial markets at that time. Many trade plans still include the RSI as a strategic component, and it’s frequently discussed in technical forex reviews.
Furthermore, Wilder’s Relative Strength Index is calculated in almost every technical analysis system or trading platform offered by an online forex broker that includes indicators.
Computing the Relative Strength Index
The RSI indicator is calculated by comparing the size of the market’s most recent price rises to the size of the market’s most recent price declines, and it is usually set up with a changeable time period parameter, which is usually set to 14 periods by default to reflect Wilder’s preferred parameter for the indicator.
The RSI’s value is likewise normalized, thus it varies or oscillates within a range that includes a low of 0 and a high of 100.
Sample Chart of the Relative Strength Index

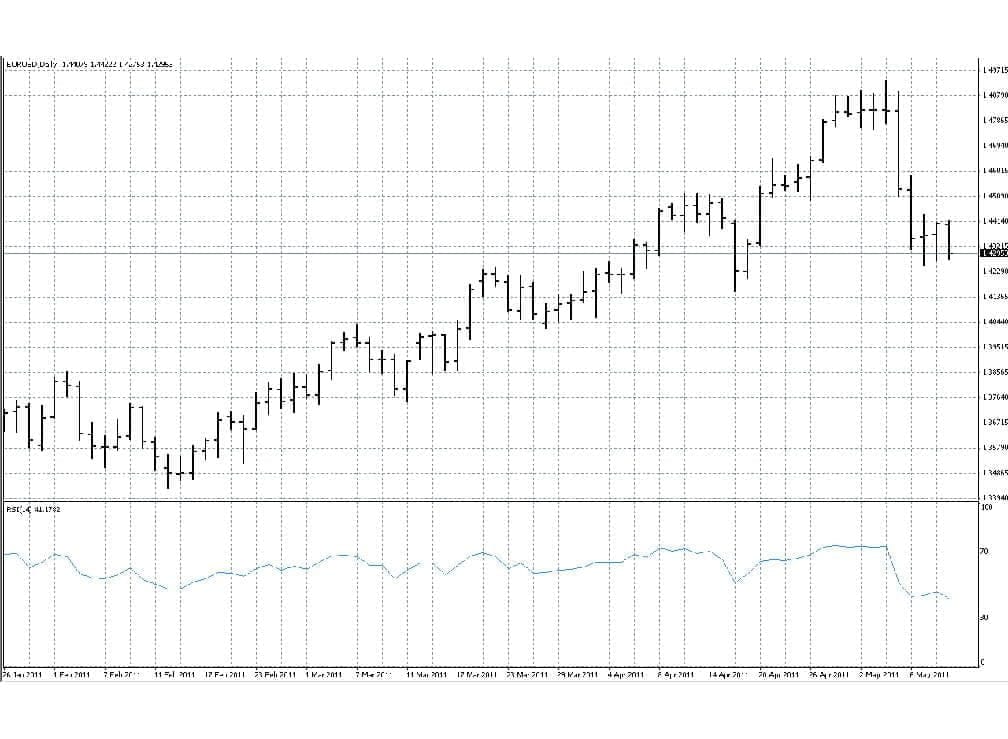
The graph above shows a daily bar chart for the EURUSD currency pair with the 14-day Relative Strength Index or RSI(14) plotted in the indicator box in pale blue beneath the price movement and on the same time scale as the price action. It was created using the popular and rather complex MetaTrader4 forex trading platform, which is used by a number of online forex brokers.
The dotted lines at 70 and 30 in the RSI(14) indicator box illustrate the borders of overbought and oversold zones, respectively, for the indicator, which can range from 0 to 100. When this chart was created using a demo online trading account, the RSI(14) indicator had a current value of 41.1782.
Applications of the Relative Strength Index
Many foreign exchange brokers’ websites highlight the RSI indicator, which has a lot of essential applications that modern technical analysts might utilize in their forex market analysis. The Relative Strength Index was first introduced by Wilder as a trading signal system that would alert traders to counter-trend transactions when its peak or trough behavior varied from that of the price movement.
Nonetheless, when combined with other technical indicators, the RSI indicator has one of its most significant applications. The RSI can be used in this case to determine whether a market is overbought or oversold, indicating that it is due for a correction.
This feature of the RSI can help trend traders determine when it’s time to exit their trend-following positions in order to re-enter them at higher levels in their online trading account in the future.
Oscillator indicators like the Relative Strength Index are also used extensively by some swing traders. During correction periods, they trade with and against the trend through their currency brokers, and the RSI can assist them predict when a correction will occur.
Traders looking for market corrections could search for RSI values above 70 for overbought markets and below 30 for oversold markets. They might also look for a price-RSI divergence signal, which occurs when the price makes a new high or low but the market lacks the momentum to propel the RSI to a new high or low.


