
The Bollinger Bands indicator is made up of two lines that are put at an equal distance above and below a central moving average line, based on volatility. The Bollinger Bands were created by John Bollinger in the 1980s, and he was the first to bring this prominent technical indicator to the financial markets. Since then, the Bollinger Bands have firmly established themselves as one of the most widely utilized technical indicators among forex traders.
Bollinger Bands are frequently used in trade plans and cited in forex technical analysis remarks due to their widespread appeal among technical traders. In addition, the majority of the leading forex brokers provide forex trading platforms and technical analysis software that display the Bollinger Bands indicator for any major currency pair.
The Bollinger Bands are often visualized by charting them over the price activity on a currency pair’s exchange rate chart. As a result, the Bollinger Bands are usually displayed on the same time scale and with the same frequency as the line, bar, or candlestick chart to which the indicator is superimposed.
Computing Bollinger Bands
Technical analysis methods provided by forex trading companies calculate the Bollinger Bands in a standardized manner. The central line is typically calculated as a simple moving average of price action over a predetermined number of periods.
The Upper Bollinger Band is formed by multiplying the indicator’s middle line by a particular amount of standard deviations of recent price movement. The Lower Bollinger Band is created by subtracting the same amount of standard deviations from the central moving average line.
The Bollinger Bands’ values are based on recent forex market price volatility using this computing approach. As a result, when volatility is low, the bands tend to shrink, whereas when volatility is high, they tend to broaden.
Most traders that use Bollinger Bands to trade forex online will compute the simple moving average using a central line parameter of 20 periods, while other types of moving average can also be employed. The Upper and Lower Bollinger Bands are commonly generated using a band width of two standard deviations of the price movement recorded over the same 20-day period by such traders.
Sample Chart of Bollinger Bands

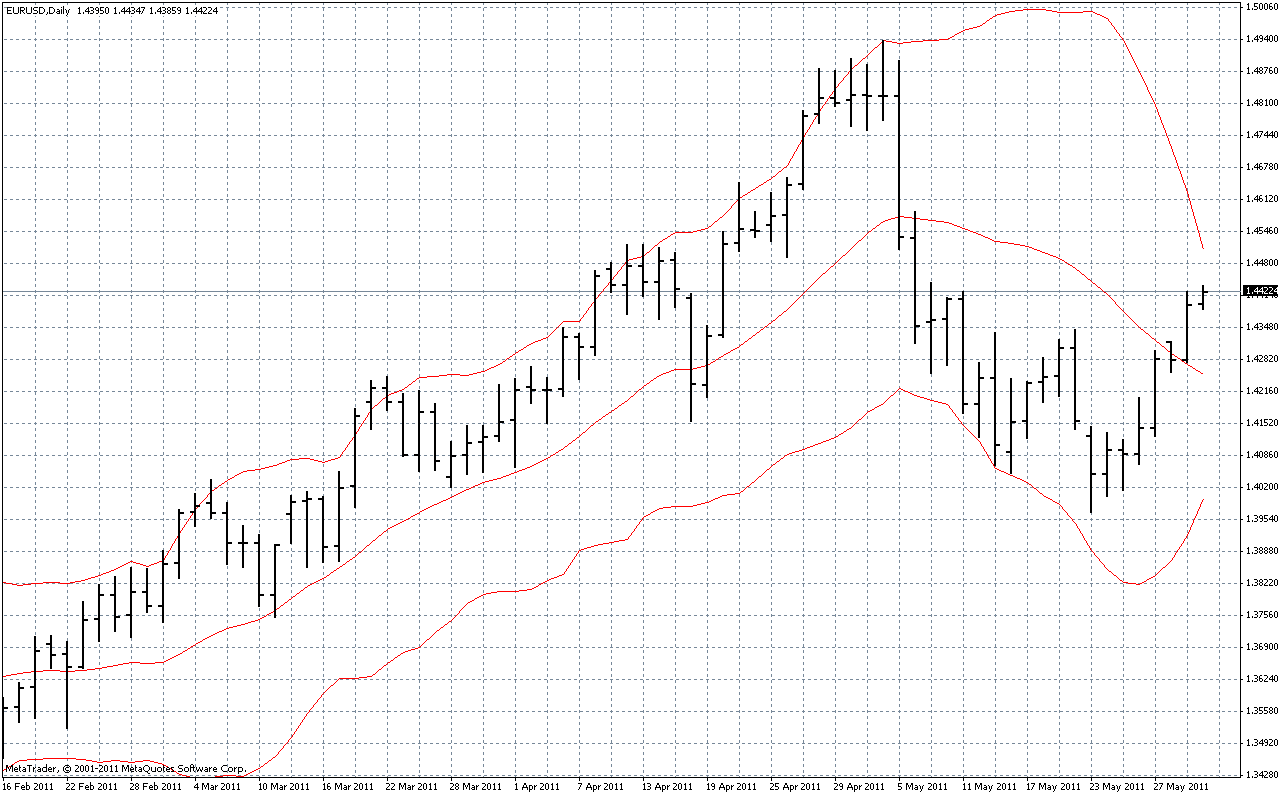
A daily price chart of EURUSD with a typical set of three (2,20) Bollinger Bands superimposed over the price action is shown in Diagram #1.
Bollinger Bands are red lines that are two standard deviations above and below the middle line, which is a basic 20 period moving average.
The Upper and Lower Bollinger Bands tend to control the price movement for EURUSD, with the central line providing support in an upwards trend and resistance in a downwards trend, as shown in the chart.
Applications of Bollinger Bands
The Bollinger Bands are one of the most useful indicators used in online forex trading to help traders gauge the risk of trading the market based on recent price activity. Riskier markets, for example, tend to have wider Bollinger Bands, whereas safer markets have narrower Bollinger Bands.
Traders may monitor for the market to cross over the center moving average line when using Bollinger Bands as a forex trading signal generator. A crossover is a condition that allows a technical analyst to produce meaningful trading indications using Bollinger Bands.
When the market crosses above its centre line, such traders may believe that the Bollinger Bands create buy signals. They might then put their take profit order in the Upper Bollinger Band region, which is likely to be overbought. Similarly, when the market crosses below the central line, sell signals can be generated, and take profit orders on stops can be placed near the Lower Bollinger Band, which can indicate oversold market conditions.
Others using swing trading tactics, on the other hand, would interpret a market above the Upper Band as a signal to sell with a take profit at the indicator’s middle line. They’d also buy if the market was trading below the Lower Bollinger Band, with a take profit put at the center line.


