Gerald Appel devised the MACD, or Moving Average Convergence Divergence, indicator, which is a mix of a histogram and a signal line. Since he first introduced the MACD to the financial markets, it has grown to become one of the most widely used technical indicators among forex traders.
The MACD histogram is frequently used in technical trade strategies and cited in technical forex market commentaries because to its vast appeal and versatility. Furthermore, the calculation of Appel’s MACD indicator is included in most technical analysis systems and forex trading platforms provided by an online forex broker.
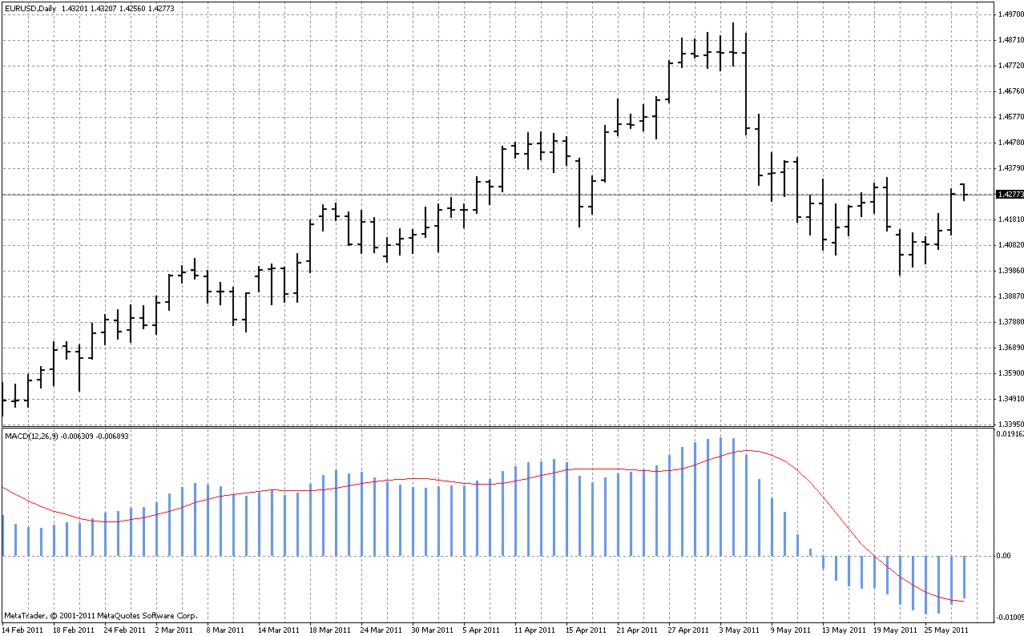
The MACD histogram is commonly displayed visually in an indicator box beneath the price action depicted on a currency pair’s exchange rate chart. The MACD histogram will usually use the same time scale and periodicity as the bar or candlestick chart it corresponds to, as shown below.
Computing the MACD
Gerald Appel devised the MACD, or Moving Average Convergence Divergence, indicator, which is a mix of a histogram and a signal line. Since he first introduced the MACD to the financial markets, it has grown to become one of the most widely used technical indicators among forex traders.
The MACD histogram is frequently used in technical trade strategies and cited in technical forex market commentaries because to its vast appeal and versatility. Furthermore, the calculation of Appel’s MACD indicator is included in most technical analysis systems and forex trading platforms provided by an online forex broker.
The MACD histogram is commonly displayed visually in an indicator box beneath the price action depicted on a currency pair’s exchange rate chart. The MACD histogram will usually use the same time scale and periodicity as the bar or candlestick chart it corresponds to, as shown below.
Sample Chart of the MACD Histogram

The (12,26,9) MACD Histogram is drawn in pale blue lines beneath the price action in the indicator box in Diagram #1, which depicts a daily EURUSD price chart. A solid red MACD trigger line is also featured, which can provide extra trading signals.
Applications of the MACD
The MACD histogram is one of forex traders’ most adaptable and effective indicators. This useful unbounded oscillator, for example, is frequently used by forex traders who want to:
Track trends, predict trend reversals, and more.
Identify markets that are overbought or oversold.
Whether you want to confirm signals given by other indicators or not,
It can be used as a full-fledged trading signal system.
When using the MACD histogram as a forex trading signal generator, traders may look for it to cross over the zero line, indicating that the two moving averages’ values are temporally similar. A crossover is a situation like this that allows a technical analyst to generate good trading recommendations.
When the faster EMA passes above the slower EMA and the MACD histogram changes from negative to positive, buy signals are generated. The faster EMA crossing below the slower EMA, which causes the MACD histogram to go from positive to negative, generates sell signals. Some traders also look for the red trigger line’s value to cross over the MACD histogram to produce buy and sell signals in the same way.


How can I set MACD on MT5?
open your mt5 and click on indicators and look for it on the list