If you use the full margin available to you in trading, you can literally double your account overnight or lose it all in a couple of hours. Traders with a lot of experience restrict their leverage and never take such a big risk. To scalp the Step index or any other index, the “hunting” method is a very basic scalping setup that only requires a price chart and one indicator.
Tools needed for the step index hunting strategy
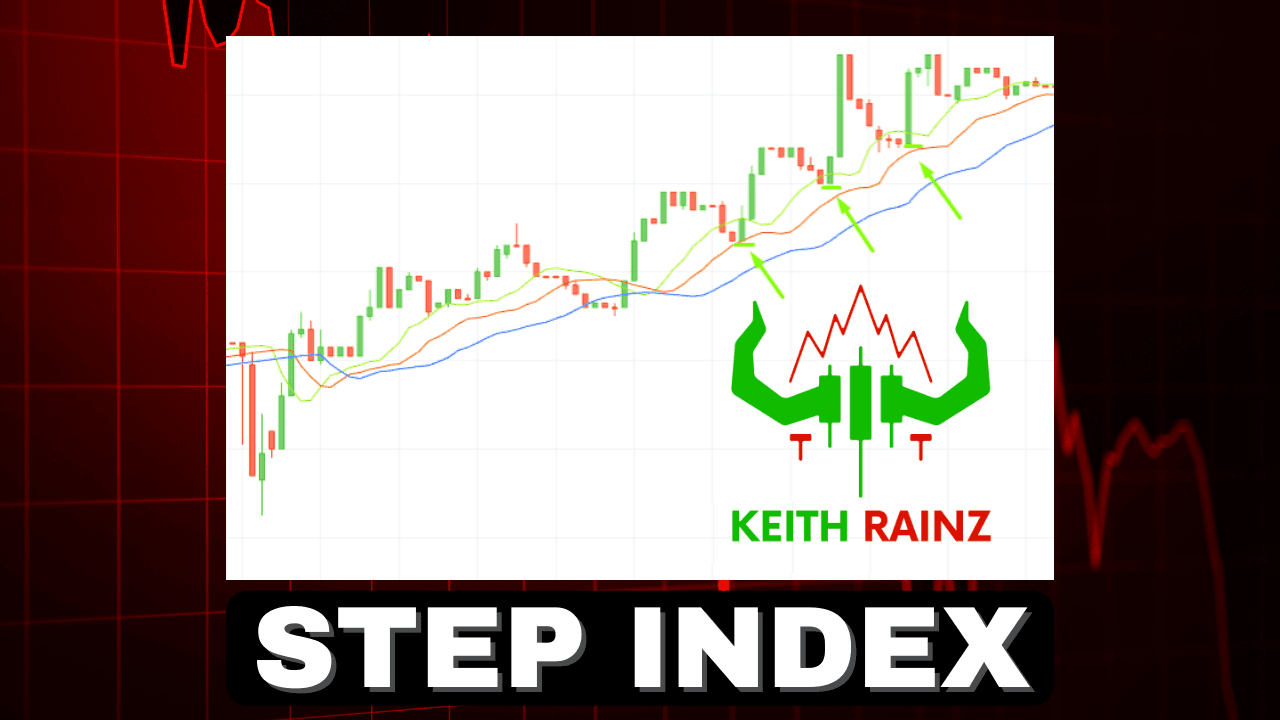
In a nutshell, you’ll need a price chart and an Alligator indicator to get started. Alligators are ruthless hunters in the wild, as you may know, praying on their prey in the undergrowth. Smoothed moving averages are used in the Williams Alligator indicator, which is a technical analysis tool. To begin, the indicator calculates a smoothed average using a simple moving average (SMA). It employs three moving averages with periods of five, eight, and thirteen periods. The Jaw, Teeth, and Lips of the Alligator are made up of three moving averages. The indicator builds trading signals via convergence-divergence relationships, with the Jaw making the slowest turns and the Lips making the fastest. When trading, the rule of thumb is to hunt when the Alligator is hunting. One question remains: when should you buy or sell? Take a look at the image below for an example.

Because the indicator is pointing downwards and the lines do not connect, it appears that all positions are suitable for a PUT or sell contract. It is, however, a mistake: it is a path to failure because the price is moving against us.
When to buy
More indicators, or so-called “assisting tools,” are required to determine the buy signal:
Remove all levels except the 50th from the Relative Strength Index (RSI) for the 14th period. The RSI is a momentum indicator that evaluates overbought or oversold circumstances in the price of a stock or other asset by measuring the magnitude of recent price fluctuations.
A Stochastic Oscillator is a momentum indicator that compares a security’s closing price to a range of its prices over a given time period. By altering the time period or taking a moving average of the result, the oscillator’s susceptibility to market changes can be reduced. It uses a 0-100 limited range of values to generate overbought and oversold trading signals. Use the Pocket Option platform’s recommended default settings.
The charting of a stochastic oscillator usually consists of two lines: one indicating the oscillator’s actual value for each session, and the other reflecting its three-day simple moving average.
How to use it
Hunting is a trading method for shorter durations, such as 5 to 15 minutes. Setting a short expiration duration, such as the formation time of 2-3 candles, is recommended. When the Alligator is hunting and all lines are moving upwards, this is the essential indication for executing the buy contract. Check if the RSI is over 50 and the fast Stochastic (blue line) crosses the slow one from bottom to top to confirm the trend, as illustrated in the screenshot below.

when to sell
When a sleeping period switches for a downward movement, it is a hint to sell. When the Alligator is hunting, a sell contract is performed, and its lines are guided lower, according to the hunting strategy. Check if the RSI is below 50 and the fast Stochastic (blue line) crosses the slow one from top to bottom to confirm the trend, as illustrated in the screenshot below.

Conclusion
The Alligator, RSI, and Stochastic indicators are used in the Hunting trading strategy. Divergence between the stochastic oscillator and the trending price action is also seen as a key reversal indication. When a negative trend reaches a new lower low but the oscillator prints a higher low, it could indicate that the bears are losing steam and a bullish reversal is on the way. Both the RSI and the stochastic oscillator are extensively utilized price momentum oscillators in technical analysis. Despite the fact that they are frequently employed together, they have different underlying theories and methodologies. The stochastic oscillator is based on the idea that closing prices should follow the current trend. To put it another way, the RSI was created to gauge the rapidity of market changes, whereas the stochastic oscillator formula performs best in trading ranges that are consistent.
Install all three indicators of the method on the price chart of your financial instrument to begin looking for trade signals. You can either go with the default settings or experiment with them until you discover the ones that work best for you.
The hunting trading technique is a simplified form of Bill Williams’ Alligator method, which is a sophisticated and multi-sided strategy. Combine the method with traditional technical analysis, such as support and resistance levels, and price patterns, to make the signals more dependable.


