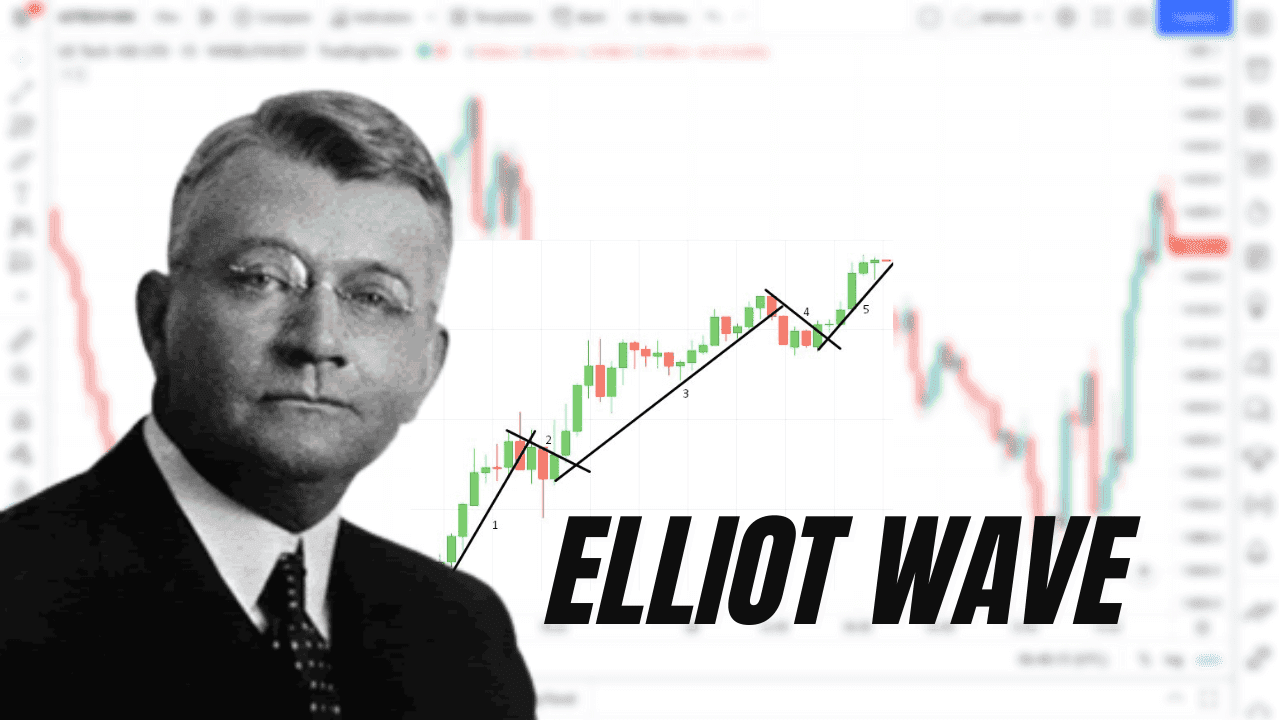
Ralph Elliott was a theorist and a professional accountant. In the 1930s, he identified the fundamental social concepts and developed analytical methods. He suggested that market prices follow precise patterns, which are now known as Elliott waves, or simply waves.
What is Elliott Wave Theory?
Elliott proposed that financial price movements were the outcome of investors’ primary psychology. He discovered that changes in public opinion always manifested themselves in the same periodic “waves” in financial markets.
The Elliott and Dow theories are similar in that they both acknowledge that stock values move in waves. Elliott, on the other hand, was able to dissect and study markets in far greater depth. Elliot began to investigate how these recurring patterns could be used to forecast future market movements.
We know in the financial markets that “what goes up, must come down,” because a price movement up or down is always followed by a price movement in the opposite direction. Price is split into two categories: trends and corrections. Prices move along a trend, while corrections go in the other direction.
Five waves travel in the main trend’s direction in uptrend, followed by three waves in downtrend in the correction’s direction (totaling a 5-3 move). The next higher wave move is divided into two subdivisions by this 5-3 motion. The impulse is formed by waves 1, 2, 3, 4, and 5, while waves 2 and 4 are corrections.

Elliot Wave Theory Explained in details
- The first wave is a beginning. It is abrupt price change triggered by a large infusion into one or another asset. It is difficult to predict because the sharks determine the trend, and lesser traders just support it.
- The second wave is a correction. It is formed as a result of partial closing of buyers’ positions and a desperate attempt by sellers to “add” to the previous position and hedge the loss.
- The third wave is the strongest. Sellers stop selling as more buyers come to the market. A steady upward movement is forming.
- The fourth wave is correction. Large players fix their profits, realizing that the current movement is already losing its relevance.
- The fifth wave is dangerous. It is formed at the expense of late buyers. It is misleading because the trend reverses sharply.
A similar situation occurs with the downward movement. However, the down trend has three waves.
How to use the Elliott Wave Theory in your trading
It goes without saying that you should enter a trade at the start of the third wave formation for successful trading. You must first analyze the wave structure and forecast the end of the second wave in order to predict its emergence.
And you will need to configure the following on your trading chart:
- Two indicators which are SMA and moving average.
- Two moving averages having parameters of 14 and 21 periods.
- Japanese candlesticks chart type.
- Timeframe – use 15m or 30m time frames.
Keep an eye out for the impulse movement, which will indicate the start of the first wave. In this situation, the 14-period moving average should cross the 21-period moving average after the flat. The intersection’s direction suggests a trend.

Build a support line if the trend is up and wait for it to break (the beginning of the formation of the second wave). Everything is the total opposite in a downtrend.

Build a resistance line (for an uptrend) or a support line (for a downtrend) with the second wave (for a downtrend).
When a breakout occurs, it indicates the start of the third wave. You can buy in the trend’s direction.

Moving averages should not touch or connect on the chart. Otherwise, the signal is false, and the market does not have a consistent trend.
Setting the expiration time to three candles is suggested.
Conclusion
Elliott Wave practitioners emphasize that just because a market is fractal doesn’t mean it’s easy to predict. Although scientists acknowledge a tree as a fractal, this does not indicate that the path of each of its branches can be predicted. In terms of practical application, the Elliott Wave Principle, like all other analysis methodologies, has its supporters and opponents.
One of the major flaws is that practitioners may always blame their chart reading rather than flaws in the theory. If that fails, there’s always the open-ended interpretation of how long it takes for a wave to complete. Traders who adhere to Elliot Wave Theory, on the other hand, are ardent supporters of the theory.


