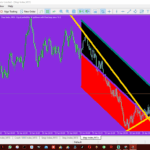
Technical analysis for every asset class includes reading candlestick charts. Performing technical analysis is mostly done to determine when it is best to enter the market and open a position. When you choose the appropriate entry and exit positions during trading, all strategies come into play. You must be aware of this goal in order to read candlestick charts correctly.
A potent yet simple-to-understand technique for detecting market direction is candlestick charts. Candlestick charts are used to show price fluctuations between opening and closing prices over a period of time. You must first comprehend what each part of a candlestick signifies in order to properly interpret one. For instance, the open at the bottom is typical of green candles.
Trading in the financial market requires forecasting future expectations as well as understanding prior behaviours. Candlestick charts give traders the information they need to understand market activity and make precise predictions.
If you trade without consulting price charts, you might think that candles are just a basic way to depict a stock’s high and low value. However, if you examine them carefully, you’ll see that they actually contain a lot more.
A candlestick chart is what?
The market action is analysed by traders using candlestick charts, which are charts made up of individual candles. Finding the price highs and lows as well as the locations where the price opened and closed for a certain period are necessary to analyse candlestick price activity.
The anatomy of candlesticks may be confusing to a novice. On the other hand, a cautious approach might make them simpler to understand and ultimately crucial. It is crucial to stay updated about market activity while you are gone since, unlike the stock market, the cryptocurrency market is open 24 hours a day.
Candlesticks are a visual representation of price simulations for virtual currencies. The most noticeable component of a candle is its body, a rectangle line that represents a digital asset’s price movement. The colour of a candlestick’s body can be either red or green, depending on the state of the market. A candlestick is made up of four fundamental parts: the open end, the close end, the high end, and the low end.
Price action can be used by traders in all financial markets to identify trends and reversals. For instance, groups of candlesticks might result in patterns that show up on different forex charts and indicate trend reversals or continuations. Additionally, individual candlestick formations may appear and represent market buy or sell entries.
Each candle’s length is determined by the trader’s chosen time period. The candle will display the open, close, high, and low for the day, making the daily time frame a popular time frame. Additionally, the varied characteristics of a candle can aid in making future price predictions; for instance, if a candle closes substantially lower than it opened, this may indicate further price declines.
several candlestick chart types.
hefty or big candles
Big Candles are self-explanatory because they are huge candles with a big price difference. This area of a candlestick chart illustrates the distinction between a large and small candle.
The candle informs us of the current supply and demand throughout its lifetime. When the price of a massive candlestick falls, it means that the supply at the moment was significantly greater than the demand. A rising candle price indicates that there is more demand than there is supply.
Dojis
A Doji candle always opens and closes at the same price despite fluctuating in price over time. It might be a minute, a day, or even an hour. The core idea of the narrative hasn’t changed: the market is in transition.
Doji candles, which have equally long wicks and are incredibly thin, represent uncertainty over a digital asset. When a cryptocurrency oscillates between the two directions before ending the price action close to or with the opening value, a Doji candle is created.
At various points, both buyers and sellers were in the lead, but it ultimately closed at the same value as when it began. Merely said, a larger candle wick simply represents greater ambivalence than a smaller candle wick.
Using a Star with a Hammer
When a stock opens at a certain price and then rises and falls to close just above that price, it is said to be shooting. It is virtually identical to the gravestone, with the exception that it closes slightly higher than the opening price rather than at the same price.
The shooting star candlestick is generally considered to be the hammer candlestick’s exact opposite. It has the appearance of a hammer that has been lowered. A shooting star candle occurs when buyers surge to open a trade, briefly advancing the price action upward before losing ground to sellers and closing below the open range.
A hammer occurs when the value of an item falls below the open range on a trading chart and then rises to close above it. This is a result of important back-and-forth control switching between suppliers and buyers.
In the same boat as the hammer The price opens, declines a little, then rises again to close just below the opening price is the hammer. This theme is strongly associated with the dragonfly candle type.
Bullish and bearish sentiments are entwined.
In this pattern, a small candlestick is followed by a bigger opposing candlestick, which totally engulfs the smaller candlestick.
The stock price has been rising for some time as a result of buyers purchasing the stock, as can be seen. The modest green candlestick at the summit is subsequently engulfed by a huge red candlestick, indicating a change in trend. This is an important indication because the previous candle is completely consumed, showing that there are far more sellers than buyers.
How should a candle on a candlestick chart be interpreted?
Three precise points are used to construct a price candle. The candles’ opening and closing prices should be taken into account initially. These points, which show the beginning and finish of an asset’s price for a specific period, will make up the candle’s body.
The candlestick shows the degree of a digital asset’s volatility in the past and predicts what to expect in the future because the cryptocurrency market is so unpredictable. Despite the fact that there are many trading tools accessible, the candlestick continues to be one of the most significant.
Each candle on the chart indicates the price movement over the selected period. Each candle on a daily chart will display the day’s open, close, upper, and lower wicks.
Open price
The open price is the initial price that was transacted as a new candle was developing. If the price begins to go upward, the candle will turn green or blue; if the price moves downward, the candle will turn red.
Close Price
The bottom price that was used to make the candle was the close price. The majority of charting tools will show red right away if the closing price is lower than the open price. The candle will be green or blue if the close price is higher than the open.
Low price
In the case of a bullish candle, the starting and closing prices may both be the lowest price traded or they may both be the bottom price of the lower shadow.
High price
The upper top denotes the highest price that was exchanged during a specific time period. If there is no upper shadow, the highest traded price will be the opening or closing price itself.
Direction
The direction of the price is indicated by the candlestick’s colour. The candle will be green if the closing price is higher than the opening price, indicating that the price is rising. If the candle is red, the price has closed below the open.
Wick
The second essential part of a candlestick is the wick, also referred to as a shadow. These details are essential since they show the price peaks and valleys for a specific charting period. Since they appear to be thinner than the body of the candlestick, the wicks are simple to identify. The candlesticks’ strength really comes through at this point. Candlesticks can help traders maintain their attention on market trend as opposed to price extremes.
Range
The range of the candle is represented by the difference between its highest and lowest price. Therefore, to obtain this amount, deduct the price at the top of the upper wick from the price at the bottom of the lower wick.
Using a candlestick chart to spot trendlines, price patterns, and Elliot waves gives traders a unique advantage if they are aware of what the points on the candle represent.
How are candlestick graphs read?
It indicates the start of a trade in an asset. Red candles have a special close since it denotes the conclusion of price activity. The high and low, on the other hand, are lines that appear above a candle’s body and display the highest and lowest values experienced during a particular price action.
It’s important to comprehend long/short candles before we get into these candles. When there are a few small bullish (green) or bearish (red) candles, a similar pattern can be seen. This is used by experienced traders to maximise volatility, enabling them to predict when to initiate trades and when to exit them in the event of a reversal. Avoid taking positions when the candle’s range or length is minimal.
The same price information is used in both candlestick charts and bar charts. Candlestick charts, on the other hand, are frequently depicted in a shape that resembles a candle with wicks or shadows on both ends. Shadows on a single line represent the high and low points.
The cryptocurrency market is ruled by market sentiments, and we’ll look at three key candlesticks that illustrate how the market thinks about various assets. The only distinction is that a longer candle denotes greater activity, whereas a shorter candle denotes less activity.
Comparison of a bar and candlestick chart
Compared to bar charts, candlestick charts have a big benefit. Like candle charts, bar charts are not as visually appealing as price patterns and candle formations. Furthermore, it is difficult to determine which way the price has moved due to the bars on the bar chart.
To sum up
More candlesticks with names on them are there, although they are not as significant. If you spent all of your time learning candlestick names and kinds, you would be missing the point. This practise is not intended to help you learn names. It all comes down to figuring out which candles, when placed in a certain order, can forecast behaviour.
The open and close numbers shown on a particular candlestick represent the supply and demand for a specific stock, respectively. It is a sign that there was demand for a stock when the opening price is greater than the closing price. When a stock’s closing price exceeds its initial price, there is more supply than there is demand.
