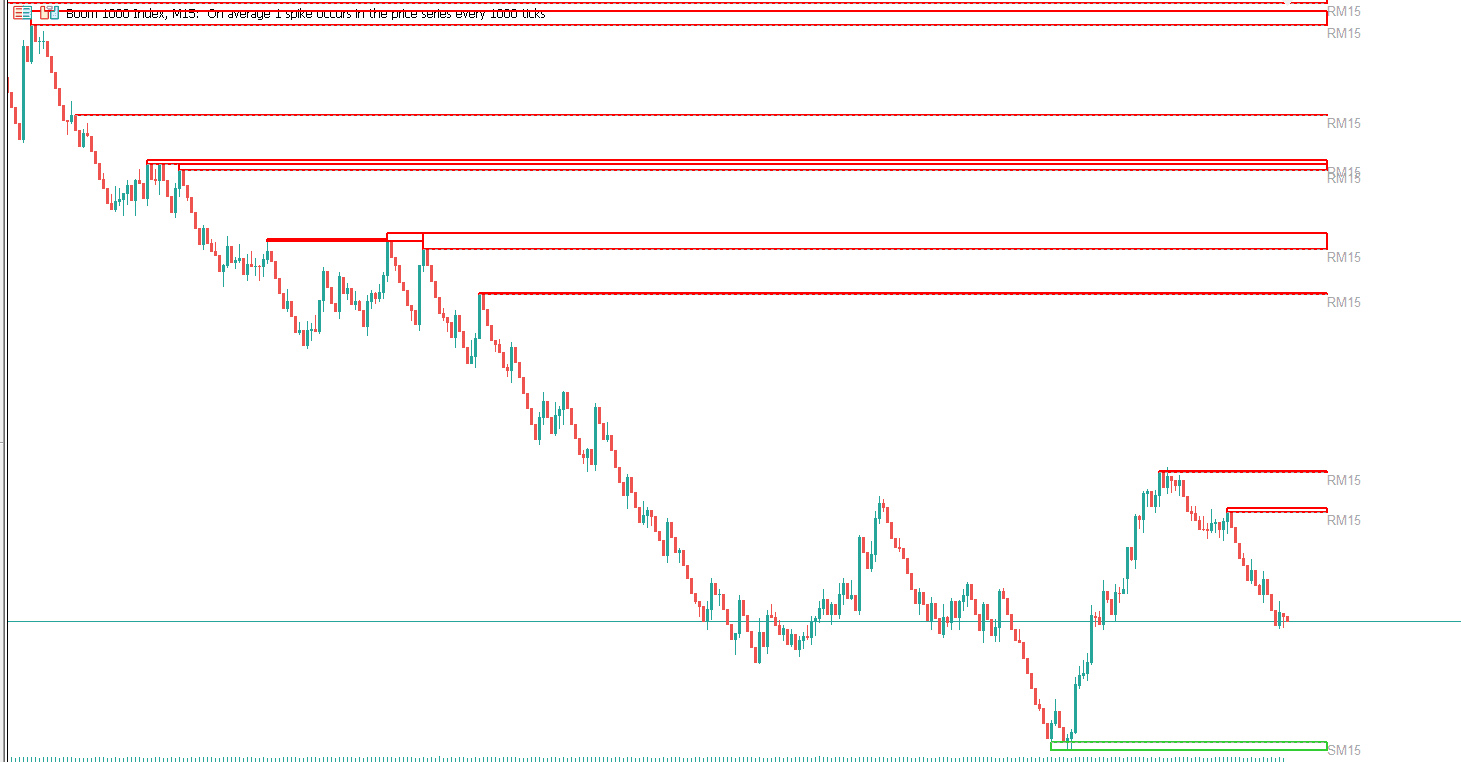
Download this Boom and Crash liquidity zones mt5 indicator for free.
There are two types of liquidity;
➡️Buy-side and sell-side. Buy-side liquidity represents a level on the chart where short sellers will have their stops positioned.
➡️Sell-side liquidity is just the opposite. It represents a level on the chart where long-biased traders will place their stops.
????In both cases, these levels are often found at or near extremes as the tops and bottoms of ranges are often viewed as areas where traders are ‘proven wrong’ and, therefore, will want to get out of their trades.
???? Smart money’ players understand the nature of this concept and commonly will accumulate or distribute positions near levels where many stops reside. It is, in part, the sheer amount of stops at key levels that allow a larger player to fully realize their position. Once the level at which many stops are placed has been traded through, it’s often that the price will reverse course and head in the opposite direction, seeking liquidity at the opposite extreme.


lookking for your MT5 PRICE NOTIFIER, it exactly what I need . please help.