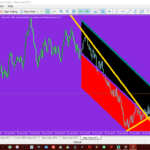
Triangles are technical analysis tools that belong to continuation patterns. This pattern frequently develops in response to a trend. For this, you need to draw them on the chart to easily identify them. You must first identify at least two highs and two lows along the trend to draw a triangle pattern. A straight line should be drawn between the two highs and the two lows and then extend the two lines together until they form a triangle.
You’ll learn more about the three different triangles in this guide. I’ll also show you how to put them to use in your binary options trading or forex trading.
Triangle patterns you must know
Triangle patterns are divided into three categories: ascending triangles, descending triangles, and symmetrical triangles.
As previously stated, each triangle must have at least two highs and two lows connected by two lines intersecting at the apex.
Let’s take a closer look at each of the three triangle patterns.
The symmetrical triangle pattern
In a ranging market, this triangle pattern appears. The bulls and bears can’t agree on which way the market should go. If you link the highs and lows, the triangle’s angles will most likely be almost equal. When a breakout happens, though, you’ll notice that a strong trend emerges. According to studies, the breakout usually occurs in the direction of the existing trend.
So, when do you enter a trade? Immediately after the breakout, trade in the direction of the new trend.
The Ascending triangle pattern
In an uptrend, this is a bullish triangle pattern that occurs. A trendline runs between the lows. The highs, on the other hand, are connected by a horizontal line (resistance) that runs through them. In the image below, notice the triangle formation. The uptrend is extremely likely to continue after this pattern appears.
So, what’s the best way to get started? Right at the point where the resistance level is broken. At this point, you should enter a 15-minute or longer purchase position.
The Descending triangle pattern
When there is a downtrend, the descending triangle pattern appears. Connect the highs of the prices with a trendline to draw it. The lows are similarly linked, but this time by a horizontal line that serves as a support.
The optimal time to enter a trade is when the price breaks through the support and the downtrend resumes.
Conclusion on trading triangle patterns
Triangle patterns are continuation patterns of a trend. When this pattern emerges, the trend is almost certain to continue in the same direction. Your major goal is to pinpoint the time at which prices will break out and begin to create a trend.
When working with longer time intervals, triangular patterns work well. That means you should use candles that last for at least 5 minutes. Your chart should also include a longer time frame of at least 30 minutes. This makes identifying these patterns and entering longer trading positions much easier.
With indicators like the MACD, triangle patterns function well. When a break out occurs, trade volume increases and the two MACD lines separate in most circumstances. This is a confirmation of the new trend. Take a look at the image below for an example.


