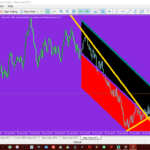
Boom and Crash indices are popular synthetic indices offered by brokers like Deriv. These indices are designed to simulate real market behavior, but they have unique characteristics that differentiate them from traditional forex pairs. Learning how to read Boom and Crash charts is crucial for anyone looking to trade these synthetic indices successfully.
In this article, we’ll explore how to read Boom and Crash charts, key concepts you need to understand, and tips to help you improve your trading strategy.
What Are Boom and Crash Indices?
Boom and Crash indices are unique synthetic assets that derive their price movements from a predetermined algorithm, not from real-world market events. Here’s a quick breakdown of each:
- Boom Index: This index is designed to rise gradually and then experience sharp, sudden drops, referred to as “spikes.” The characteristic pattern of Boom is an upward movement followed by a spike down.
- Crash Index: The Crash index behaves in the opposite way to Boom. It rises sharply and then experiences sharp drops. The characteristic of Crash is that it moves downward and then “spikes” upwards.
Traders use Boom and Crash indices to speculate on price movements, identifying trends, and making predictions on when the next spike will occur.
Key Concepts in Reading Boom and Crash Charts
To effectively read Boom and Crash charts, you need to understand the following concepts:
1. Candlestick Patterns
Like other financial markets, Boom and Crash indices use candlestick charts to represent price movements. Each candlestick shows the open, high, low, and close price for a specific time period. These patterns can help you identify potential trend reversals or continuation signals.
For example:
- A bullish engulfing candle could indicate a potential upward movement in the Crash index.
- A bearish engulfing candle might signal a downtrend or potential spike in the Boom index.
2. Spikes
Spikes are the most significant feature of both Boom and Crash indices. These sharp, sudden price movements can catch traders by surprise. Here’s what to look for:
- Boom Spikes: In Boom, the price rises steadily, but occasionally, you’ll see a sharp drop (spike) after the price reaches a certain level.
- Crash Spikes: Similarly, in Crash, the price will decrease slowly until a sudden upward spike occurs.
These spikes create unique opportunities for traders, especially for those who use scalping strategies.
3. Trend Analysis
Trend analysis is essential for reading Boom and Crash charts effectively. Both indices have visible trends where prices rise and fall gradually. By analyzing the trend direction, you can decide whether to buy or sell:
- Boom: If the price is moving upward, it’s generally a good time to wait for a spike to sell.
- Crash: If the price is moving downward, look for a potential spike upward to buy.
4. Support and Resistance
Like in traditional markets, support and resistance levels are key to predicting where price movements might change direction.
- Support Level: The price level at which a downward trend reverses, causing a spike upward in Crash.
- Resistance Level: The price level at which an upward trend reverses, resulting in a spike downward in Boom.
Identifying these levels can help you decide when to enter or exit the market.
How to Read Boom and Crash Charts
Step 1: Analyze the Trend
Start by analyzing the overall trend of the Boom or Crash index. The trend will help you determine whether to anticipate an upward or downward movement. You can use trendlines or simply observe the direction of the price over time.
For example:
- In Boom, if the price is steadily increasing, it suggests a potential upward trend.
- In Crash, if the price is dropping, it could indicate a downward trend.
Step 2: Look for Spikes
Once you’ve identified the trend, watch for sudden, sharp price movements (spikes). These spikes occur frequently and can be quite large in comparison to the gradual price movements.
For instance:
- Boom Spikes occur when the market surges up before a quick drop.
- Crash Spikes occur when the market sharply falls and then rises again.
Step 3: Use Indicators for Confirmation
To get more clarity on the chart’s movement, you can use several technical indicators to confirm the trend or spike. Some commonly used indicators include:
- Moving Averages: Moving averages help you spot the general trend. For instance, when the price is above a moving average, it suggests an uptrend.
- Relative Strength Index (RSI): This is used to identify overbought or oversold conditions, which can signal when a spike might occur.
- Bollinger Bands: These can help you identify periods of low volatility, which might precede a spike.
Step 4: Watch the Timeframe
Timeframes play a crucial role in reading Boom and Crash charts. The time frame you choose determines how much data is shown on the chart:
- Shorter Timeframes (M1, M5, M15): These are ideal for traders who are looking for quick trades and scalp opportunities. You’ll see more frequent spikes and price movement.
- Longer Timeframes (H1, H4): These are better for identifying the broader market trends and planning longer-term trades.
Step 5: Entry and Exit Points
Once you’ve analyzed the trend and the likelihood of a spike, it’s time to decide when to enter and exit the market.
- For Boom: Enter when the market shows consistent upward movement and exit when the price starts to decline after a spike.
- For Crash: Enter when the market is on a downward trend and exit when the price begins to spike upward.
Trading Strategies for Boom and Crash Indices
Here are a few strategies you can use when reading Boom and Crash charts:
1. Scalping Strategy
Scalping is a popular strategy for Boom and Crash trading, especially for short-term traders. The goal is to make small profits from small price movements.
- For Boom, look for consistent upward movement, and sell when the price begins to drop after a spike.
- For Crash, look for consistent downward movement, and buy when the price starts to rise after a downward spike.
2. Trend Reversal Strategy
This strategy involves identifying trends and trading when the market is about to reverse.
- In Boom, you might enter a sell position when the price reaches a resistance level and starts to drop after a spike.
- In Crash, you could enter a buy position when the price reaches a support level and begins to rise after a spike.
3. Breakout Strategy
The breakout strategy involves waiting for the price to break through a key level of support or resistance.
- Boom: Wait for a breakout above a resistance level and look for a possible spike downward.
- Crash: Wait for a breakout below a support level and anticipate a possible spike upward.
Conclusion
Reading Boom and Crash charts effectively is a skill that takes time and practice to develop. The key to successful trading lies in understanding the unique features of these indices, such as their tendency to spike, and using that information to make informed trading decisions. By combining technical analysis, risk management strategies, and your own observations of market behavior, you can improve your chances of making profitable trades in Boom and Crash.


Thanks for the info
welcome