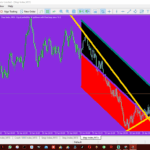
There are 3 forex charts namely line charts, bar charts and most widely used Japanese candlesticks.
Line Charts
A line chart can be used to illustrate price change. You can as well use line charts to analyze price movement. However, Japanese Candlesticks are most commonly employed to read charts and analyze the current market position.
Japanese candlesticks
The body and the wick of a candlestick carry information about price changes over a specific time period.
The opening and closing prices are displayed on the bodies border, while the price maximum and minimum are displayed on the wick’s upper and lower borders.
The candlestick turns green when the price of an asset rises. The candlestick turns red when the price falls. A five-minute candlestick contains data on price fluctuations over a five-minute period. You may alternatively think of it as five one-minute periods with the same data but on a different scale.
Bar charts
The same logic applies to bars. They’re made up of two vertical lines and two short perpendicular lines on the left and right sides. Vertical lines show the price minimum and maximum, while perpendicular lines show the opening and closing prices.
Conclusion
Professional traders like to use Japanese Candlesticks. The usefulness of a candlestick chart lies in its striking simplicity and breadth of information. Traders acquire not only an image, but also a full-fledged fundamental analytical tool, without which most indicators would be impossible to calculate.


