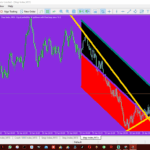
One of the most critical abilities a trader can have is the ability to recognize support and resistance levels. This ability allows you to see how the price reacts when it approaches a support or resistance level. As a result, determining the ideal spots to enter or quit an open position becomes easier.
In some cases, the price will hit resistance or support and then reverse. In other cases, it will break through the levels of support or resistance. This video guide will teach you how to spot when a price is attempting to break through a level of support or resistance. It also demonstrates what you should do in such a situation.
How do you know when the price is about to break through the support or resistance?
I’m assuming you’re familiar with support and resistance levels. However, in case you didn’t know, these are price levels within which prices appear to range. That is, prices do not appear to fluctuate much above or below these levels over time. Support and Resistance, the two most important technical indicators for Pocket Option traders, will be covered in depth in this book.
When the price of an asset changes over time, it usually reaches a point where it returns to its previous level. This is the resistance or support. At the lower price point, support forms, whereas at the higher price point, resistance arises. The levels of support and resistance are either modest or strong.
The number of times the price has struck a support/resistance level before rebounding back is used to determine its strength. Strong support and resistance levels are ones that the price has crossed several times in a short period of time. It’s deemed weak if price only strikes a support or resistance level once before breaking through. To break through a significant support/resistance level, price momentum must be rather strong.
How to know if price momentum is strong enough to break through support/resistance
You should first detect the dominant trend using a candles chart. If it’s a really strong one, you’ll note that the candles that form are generally larger, with two or more of the same color candle forming in a row.
You can also expect substantial price momentum if there is a news or economic event on the horizon. Prices will move in a specific direction shortly after the news is released, frequently breaking through support/resistance levels.
In some cases, a price consolidation occurs just before it reaches the support or resistance level. That is, the price is restricted to a small range. The price has gathered enough momentum as it approaches the support/resistance level to break through. However, before finally breaking through, the price frequently falls back into the range.
How to avoid false breakouts
False breakouts happen when the price breaks out of the support/resistance level only to fall back into the range very quickly before the trend reverses. The majority of traders lose money due to false breakouts.
Examining how the price behaves when it meets strong support/resistance is one technique to avoid false breakouts. That is, what kind of pattern emerges?
When the prices hit the resistance, they will develop a downturn, as seen in the image below. When the price breaks through resistance but remains above it, this is known as a fake breakout.
Then a solid bear candle breaks through the support, signaling the start of a decline. This is the place where you should start your business.
What should you do if the price breaks through the level of support or resistance?
You can expect the trend to continue in the same direction if the price breaks through a weak support/resistance level. Consider how the price reacts when it reaches a strong level of support or resistance.
If you look at our chart above, you’ll notice that the price is frequently in a downward trend. Wait until the markets behave like they did when prices hit the support/resistance level if the breakout occurs. It’s now or never to get into a trade based on the current trend.
What causes false breakouts? False breakouts happen when traders enter a market that is already overextended and poised to reverse. In the case above, it’s likely that many traders anticipated the trend would continue upward.
Professional traders, on the other hand, understand the importance of waiting till the markets behave as they did when prices hit the strong resistance level. When this happened, the downtrend began to indicate that it was time to sell.
To avoid false breakouts, enter trades based on price movements.
Knowing how price responds when it reaches a support/resistance, as I indicated, gives you a notion of how to trade when it does so again.
As a result, it is critical to read your chart. In comparison to your trading sessions, I normally propose that you trade using a wider time frame chart. If you’re trading 5 minute candles, for example, you should look at the 30 minute or 3 hour chart.
Conclusion
There are times when the price breaks through the support/resistance levels repeatedly. Additional tools and indicators might assist you in determining the optimal time to enter your trades.
The Pocket Option Bollinger Bands indicator is a valuable tool. This indication can be used in a variety of ways. When price approaches the support/resistance zone before falling and breaching the lower band, for example, this is a signal to sell.
Support/resistance trading is a skill that takes a lot of patience and experience to master. Once the price breaks through the support/resistance, your goal should be to choose the best trade entry position.


